Managing and keeping tabs of network traffic on Linux


Is your Net connection slow? Ever wonder what the hell's going down the wire? Here are five free and effective tools to diagnose network traffic issues.
If you've been using Linux for a while, no doubt you're already amazed with the amount of software there is for you to use, for free. My own last count revealed in excess of three thousand applications ready to install and use. But how do we find the gems?
Look no further, because here they are. These are tools I use on a daily basis to both diagnose my own Internet connections and network performance in remote hosts. You can't claim to be a network management expert if you haven't used at least 5 of these tools, but you don't need to be an expert to use them either, because they're brutally easy to use.
The net essentials in our toolbox
Let's explore the first three tools in our toolset. They're powerful and easy enough for you to get an overview of what's going on with your Net connection.
KSysGuard: view aggregate network traffic
My favorite, in all aspects, is KSysGuard. With it, you can plot network usage for all your network interfaces (even though in 99% of all cases, there's only one network interface, and it's named eth0). Take a look at this screenshot:
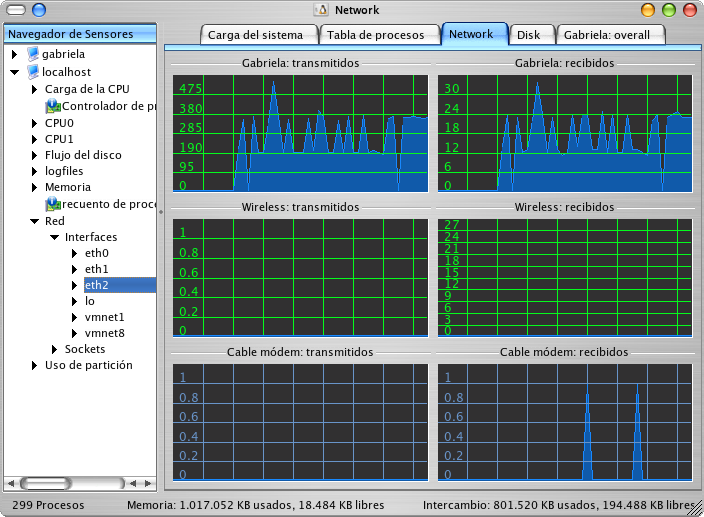
It's not black magic. It's a sheet divided in rectangles, where you can drag and drop the sensors listed on the left to any of the empty rectangles on the right. When you place any of the sensors on the left, KSysGuard starts plotting.
Bonus points for KSysGuard: you can keep tabs on a remote machine via SSH. All you need to do is:
- create an account on the remote machine,
- install a small program named
ksysguardd(which you can find after installing KSysGuard in the path/usr/bin/ksysguardd) on the remote machine, - set up passwordless SSH authentication for that account,
- connect with KSysGuard to the remote machine using File -> Connect to machine...
The ksysguardd program is self-contained so you can be confident you won't be introducing security issues.
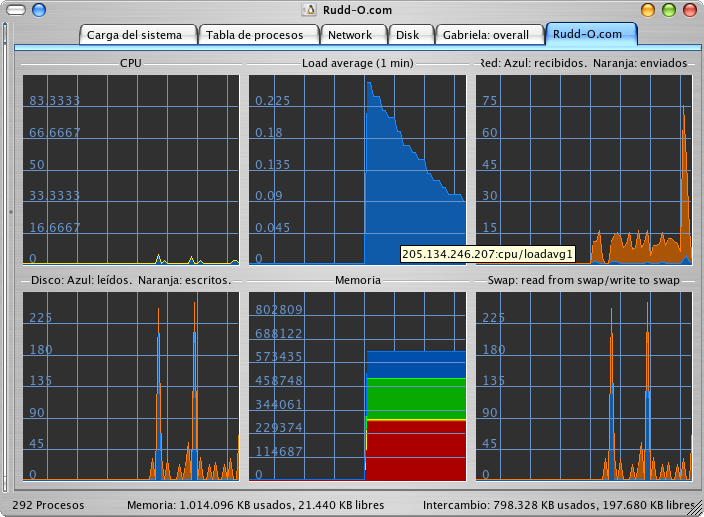
Here's an overview sheet plotted from a remote machine (in this case, this Web host):
Here's another, showing my MythTV PVR and backup machine:
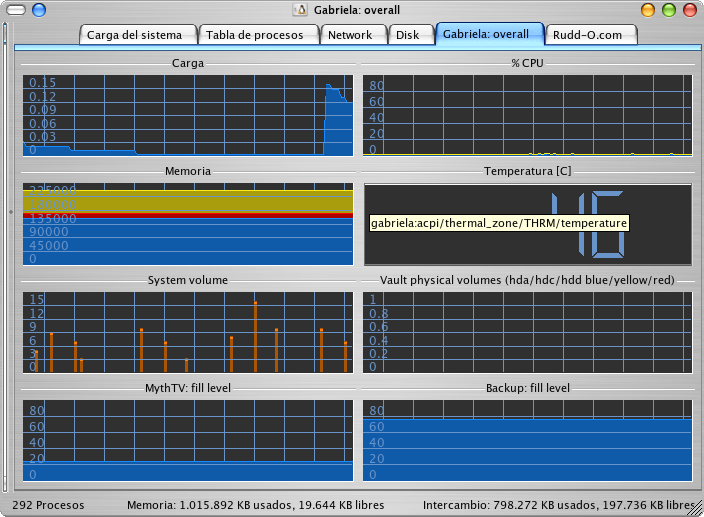
Oh, did I mention KSysGuard can plot much, much more than just network traffic? I guess not, but the screenshots speak for themselves. Oh, and the screens are fully customizable, down to the colors used to plot the graphs. You can save the worksheets for later usage as well.
To install this tool, use your distribution's favorite package manager, and look for KSysGuard or the kdeadmin package.
In the next page, we'll explore the different uses of netstat.
(May I respectfully request, if you like this article, that you use one of the links right below to submit it to your favorite news site?)
netstat: dumb but it does the job
What if you want to find out which programs are communicating with hosts on the Internet? That's netstat's job.
Since netstat is a terminal program, I'm gonna open a terminal program to get the following screenshots. Do not worry -- you can follow the examples alright, because (despite what Windows zealots think) the terminal does not bite. Trust me: I was bitten by a Rottweiler once (quite the scare!), but so far not ever by the terminal. Swear to God!
(No, the terminal in Linux is not as stupid as MS-DOS. In fact, MS-DOS got nothin' on the Linux terminal. The Linux terminal can show you random fortune cookies -- try pulling fortunes out of MS-DOS, bitch! And unlike MS-DOS, you don't need to be a rocket scientist to type on the Linux console.)
rudd-o@karen:~$ netstat -tnp
Active Internet connections (w/o servers)
Proto Recv-Q Send-Q Local Address           Foreign Address         State       PID/Program name
tcp        0      0 190.10.133.30:57830     64.4.37.20:1863         ESTABLISHED20312/kopete
tcp        0      0 190.10.133.30:35859     207.46.107.27:1863      ESTABLISHED20312/kopete
tcp        0      0 190.10.133.30:33625     64.12.26.74:5190        ESTABLISHED20312/kopete
tcp        0      0 190.10.133.30:55528     207.46.27.27:1863       ESTABLISHED20312/kopete
tcp        0      0 190.10.133.30:32943     205.134.246.207:143     ESTABLISHED6965/evolution
tcp        0      0 190.10.133.30:45010     201.234.195.35:22       ESTABLISHED6291/ssh
tcp        0      0 190.10.133.30:41794     207.46.26.111:1863      ESTABLISHED20312/kopete
tcp        0      0 190.10.133.30:39049     207.46.107.57:1863      ESTABLISHED20312/kopete
tcp        0      0 190.10.133.30:55288     64.4.36.21:1863         ESTABLISHED20312/kopete
tcp        0      0 190.10.133.30:58186     207.46.26.79:1863       ESTABLISHED20312/kopete
tcp        0      0 190.10.133.30:44143     203.174.86.130:22       ESTABLISHED4436/ssh
tcp        0      0 190.10.133.30:50222     207.46.26.121:1863      ESTABLISHED20312/kopete
tcp        0      0 190.10.133.30:40477     207.46.27.34:1863       ESTABLISHED20312/kopete
tcp        0      0 190.10.133.30:50458     207.46.26.69:1863       ESTABLISHED20312/kopete
tcp        0      0 127.0.0.1:37979         127.0.0.1:22            ESTABLISHED26792/nxssh
tcp        0      0 190.10.133.30:42312     65.54.228.45:1863       ESTABLISHED20312/kopete
tcp        0      0 190.10.133.30:38203     85.17.40.227:80         ESTABLISHED12728/ktorrentQ0Chw
tcp        0      0 190.10.133.30:38026     85.17.40.227:80         ESTABLISHED6482/ktorrentO6i7Ib
tcp        0      0 190.10.133.30:36559     85.17.40.227:80         ESTABLISHED8756/ktorrentscWrEa
tcp        0      0 190.10.133.30:33910     85.17.40.228:80         ESTABLISHED8745/ktorrentUEYsvc
tcp        0      0 190.10.133.30:33679     85.17.40.227:80         ESTABLISHED11637/ktorrentEVzOe
tcp        0      0 190.10.133.30:41446     205.134.246.207:22      ESTABLISHED30037/ssh
tcp        0      0 190.10.133.30:34096     85.17.40.228:80         ESTABLISHED25019/ktorrentQwA3q
tcp        0      0 190.10.133.30:34395     85.17.40.227:80         ESTABLISHED25495/ktorrentlqrhg
tcp        0      0 190.10.133.30:33537     207.46.26.193:1863      ESTABLISHED20312/kopete
tcp        0      0 192.168.3.1:48198       192.168.3.2:22          ESTABLISHED5922/ssh
tcp        0      0 190.10.133.30:60241     216.239.51.125:5223     ESTABLISHED20312/kopete
tcp        0      0 190.10.133.30:35334     207.46.26.171:1863      ESTABLISHED20312/kopete
tcp        0      0 190.10.133.30:56878     85.17.40.227:80         ESTABLISHED4060/ktorrentMT0VEb
tcp        0      0 190.10.133.30:56819     85.17.40.227:80         ESTABLISHED4059/ktorrentuhNgxa
tcp        0      0 190.10.133.30:56575     85.17.40.227:80         ESTABLISHED4051/ktorrentvWDA2b
tcp        0      0 192.168.3.1:42163       192.168.3.2:4713        ESTABLISHED5733/amarokapp
tcp        0      0 190.10.133.30:57884     205.134.246.207:22      ESTABLISHED8500/ssh
tcp        0      0 190.10.133.30:51115     85.17.40.227:80         ESTABLISHED11635/ktorrent3bmrc
tcp        0      0 190.10.133.30:34656     207.46.26.185:1863      ESTABLISHED20312/kopete
tcp        0      0 190.10.133.30:49335     65.54.228.32:1863       ESTABLISHED20312/kopete
tcp        0      0 190.10.133.30:34686     205.134.246.207:80      TIME_WAIT  -
tcp        0      0 192.168.3.1:60960       192.168.3.2:22          ESTABLISHED29903/ssh
tcp6       0      0 ::ffff:127.0.0.1:22     ::ffff:127.0.0.1:37979  ESTABLISHED26793/sshd: rudd-o
You can see netstat (invoked with the tnp arguments -- TCP, show IP addresses, show programs) on that screenie, which comes up instantly after you've hit ENTER.
Sometimes it's useful to see host names instead of just IP addresses -- for that, you can use netstat -tp, removing the n argument. That will take a bit longer, but in the end will show something like this:
rudd-o@karen:~$ netstat -tp
Active Internet connections (w/o servers)
Proto Recv-Q Send-Q Local Address           Foreign Address         State       PID/Program name
tcp        0      0 30.cpe-190-10-133:35859 by1msg3145616.phx.:msnp ESTABLISHED20312/kopete
tcp        0      0 30.cpe-190-10-133:33625 64.12.26.74:aol         ESTABLISHED20312/kopete
tcp        0      0 30.cpe-190-10-133:55528 by2msg2132816.phx.:msnp ESTABLISHED20312/kopete
tcp        0      0 30.cpe-190-10-133:32943 tobey.rudd-o.com:imap2  ESTABLISHED6965/evolution
tcp        0      0 30.cpe-190-10-133:45010 lujor.com:ssh           ESTABLISHED6291/ssh
tcp        0      0 30.cpe-190-10-133:41794 by2msg1242016.phx.:msnp ESTABLISHED20312/kopete
tcp        0      0 30.cpe-190-10-133:39049 by1msg3245804.phx.:msnp ESTABLISHED20312/kopete
tcp        0      0 30.cpe-190-10-133:55288 by1msg4082108.phx.:msnp ESTABLISHED20312/kopete
tcp        0      0 30.cpe-190-10-133:58186 by2msg1161905.phx.:msnp ESTABLISHED20312/kopete
tcp        0      0 30.cpe-190-10-133:44143 node6501.gplhost.co:ssh ESTABLISHED4436/ssh
tcp        0      0 30.cpe-190-10-133:50222 by2msg1262105.phx.:msnp ESTABLISHED20312/kopete
tcp        0      0 30.cpe-190-10-133:40477 by2msg2233102.phx.:msnp ESTABLISHED20312/kopete
tcp        0      0 30.cpe-190-10-133:50458 by2msg1141816.phx.:msnp ESTABLISHED20312/kopete
tcp        0      0 localhost:37979         localhost:ssh           ESTABLISHED26792/nxssh
tcp        0      0 30.cpe-190-10-133:42312 by1msg3082308.phx.:msnp ESTABLISHED20312/kopete
tcp        0      0 30.cpe-190-10-133:38203 85.17.40.227:www        ESTABLISHED12728/ktorrentQ0Chw
tcp        0      0 30.cpe-190-10-133:38026 85.17.40.227:www        ESTABLISHED6482/ktorrentO6i7Ib
tcp        0      0 30.cpe-190-10-133:36559 85.17.40.227:www        ESTABLISHED8756/ktorrentscWrEa
tcp        0      0 30.cpe-190-10-133:33910 85.17.40.228:www        ESTABLISHED8745/ktorrentUEYsvc
tcp        0      0 30.cpe-190-10-133:33679 85.17.40.227:www        ESTABLISHED11637/ktorrentEVzOe
tcp        0      0 30.cpe-190-10-133:41446 tobey.rudd-o.com:ssh    ESTABLISHED30037/ssh
tcp        0      0 30.cpe-190-10-133:34096 85.17.40.228:www        ESTABLISHED25019/ktorrentQwA3q
tcp        0      0 30.cpe-190-10-133:34395 85.17.40.227:www        ESTABLISHED25495/ktorrentlqrhg
tcp        0      0 30.cpe-190-10-133:33537 by2msg1104414.phx.:msnp ESTABLISHED20312/kopete
tcp        0      0 30.cpe-190-10-133:33537 by2msg1104414.phx.:msnp ESTABLISHED20312/kopete
tcp        0      0 karen:48198             gabriela:ssh            ESTABLISHED5922/ssh
tcp        0      0 30.cpe-190-10-133:60241 kc-in-f125.google.:5223 ESTABLISHED20312/kopete
tcp        0      0 30.cpe-190-10-133:35334 by2msg1282513.phx.:msnp ESTABLISHED20312/kopete
tcp        0      0 30.cpe-190-10-133:56878 85.17.40.227:www        ESTABLISHED4060/ktorrentMT0VEb
tcp        0      0 30.cpe-190-10-133:56819 85.17.40.227:www        ESTABLISHED4059/ktorrentuhNgxa
tcp        0      0 30.cpe-190-10-133:56575 85.17.40.227:www        ESTABLISHED4051/ktorrentvWDA2b
tcp        0    232 karen:42163             gabriela:4713           ESTABLISHED5733/amarokapp
tcp        0      0 30.cpe-190-10-133:57884 tobey.rudd-o.com:ssh    ESTABLISHED8500/ssh
tcp        0      0 30.cpe-190-10-133:51115 85.17.40.227:www        ESTABLISHED11635/ktorrent3bmrc
tcp        0      0 30.cpe-190-10-133:34656 by2msg1104406.phx.:msnp ESTABLISHED20312/kopete
tcp        0      0 30.cpe-190-10-133:49335 by1msg3082119.phx.:msnp ESTABLISHED20312/kopete
tcp        0      0 karen:60960             gabriela:ssh            ESTABLISHED29903/ssh
tcp6       0      0 localhost:ssh           localhost:37979         ESTABLISHED26793/sshd: rudd-o
What if you want to know which programs are listening on network events on your computer? Use netstat -ltnpu to see that:
rudd-o@karen:~$ netstat -ltnpu
Active Internet connections (only servers)
Proto Recv-Q Send-Q Local Address           Foreign Address         State       PID/Program name
tcp        0      0 0.0.0.0:7013            0.0.0.0:*               LISTEN     26831/nxagent
tcp        0      0 192.168.3.1:873         0.0.0.0:*               LISTEN     2347/rsync
tcp        0      0 0.0.0.0:8010            0.0.0.0:*               LISTEN     20312/kopete
tcp        0      0 0.0.0.0:139             0.0.0.0:*               LISTEN     23655/smbd
tcp        0      0 0.0.0.0:81              0.0.0.0:*               LISTEN     23876/apache2
tcp        0      0 0.0.0.0:21              0.0.0.0:*               LISTEN     5549/vsftpd
tcp        0      0 192.168.3.1:25          0.0.0.0:*               LISTEN     3520/master
tcp        0      0 127.0.0.1:25            0.0.0.0:*               LISTEN     3520/master
tcp        0      0 0.0.0.0:445             0.0.0.0:*               LISTEN     23655/smbd
tcp6       0      0 :::7013                 :::*                    LISTEN     26831/nxagent
tcp6       0      0 :::22                   :::*                    LISTEN     655/sshd
udp        0      0 0.0.0.0:32768           0.0.0.0:*                          5306/avahi-daemon:
udp        0      0 0.0.0.0:514             0.0.0.0:*                          5147/syslogd
udp        0      0 192.168.3.1:137         0.0.0.0:*                          23653/nmbd
udp        0      0 192.168.2.4:137         0.0.0.0:*                          23653/nmbd
udp        0      0 0.0.0.0:137             0.0.0.0:*                          23653/nmbd
udp        0      0 192.168.3.1:138         0.0.0.0:*                          23653/nmbd
udp        0      0 192.168.2.4:138         0.0.0.0:*                          23653/nmbd
udp        0      0 0.0.0.0:138             0.0.0.0:*                          23653/nmbd
udp        0      0 0.0.0.0:67              0.0.0.0:*                          9964/dhcpd
udp        0      0 0.0.0.0:68              0.0.0.0:*                          20406/dhclient3
udp        0      0 0.0.0.0:8010            0.0.0.0:*                          20312/kopete
udp        0      0 0.0.0.0:5353            0.0.0.0:*                          5306/avahi-daemon:
You can see I run a pretty tight machine -- by the way, hackers, don't bother because those services listening on all network interfaces are firewalled to the outside world.
The next page discusses mtr -- the rich man's traceroute.
mtr: the rich man's traceroute
I'm gonna stop for a while and thank my fabulous boss and friend Thomas Goirand for showing me this tool. Hi, Thomas! Up to the day he showed me this tool, I was stuck using the old traceroute and...
...I see I've abandoned my audience for a while there. OK, let's get back to business. traceroute is an old-school tool that attempts to find out the route Internet packets take from one machine to another. It sort of "pings" each hop in the way, displaying the time it took for each "pong" to turn around and "return to the mothership".
As you can see, it's very useful if you want to find out why a particular Internet host (that's technicalese for "computer") is not responding. Say I want to traceroute this host from home:
rudd-o@karen:~$ traceroute -n rudd-o.com
traceroute to rudd-o.com (205.134.246.207), 30 hops max, 40 byte packets
 1  190.10.133.1  24.185 ms  9.690 ms  8.959 ms
 2  200.25.144.81  7.929 ms  8.949 ms  48.975 ms
 3  200.63.192.2  10.743 ms  38.930 ms  8.950 ms
 4  84.16.9.153  129.928 ms  131.279 ms  119.625 ms
 5  213.140.43.206  122.800 ms  131.904 ms  144.903 ms
 6  84.16.12.170  120.918 ms  116.912 ms 213.140.36.106  154.041 ms
 7  213.140.43.182  130.707 ms 213.140.38.162  119.989 ms 213.140.43.182  129.829 ms
 8  213.140.37.214  117.842 ms 84.16.12.193  131.958 ms 213.140.37.29  119.965 ms
 9  213.140.43.193  300.844 ms  219.831 ms 213.140.36.89  131.913 ms
10  4.71.122.5  127.874 ms  126.879 ms 84.16.12.158  134.978 ms
11  4.71.122.5  136.897 ms 84.16.12.165  154.934 ms  153.903 ms
12  4.69.135.6  168.898 ms 4.69.135.2  128.928 ms 4.69.135.6  140.870 ms
13  4.71.122.5  138.928 ms * 4.69.132.77  281.783 ms
14  4.68.102.108  159.037 ms 4.69.132.77  196.766 ms 4.68.122.30  149.823 ms
15  4.69.135.6  146.927 ms 4.68.102.172  167.857 ms 64.156.173.126  168.168 ms
16  216.193.255.182  162.990 ms  161.532 ms  162.902 ms
17  216.193.192.186  155.931 ms  158.558 ms 4.68.102.44  171.051 ms
18  205.134.246.207  158.107 ms 216.193.192.186  168.646 ms 205.134.246.207  158.128 ms
At three pings per hop (on each row) you can see my information takes eighteen hops from home to, well, this different home :-). Of course, if any of those hops is having a problem, traceroute will tell you -- and therein lies the value of traceroute, because it can tell you exactly where is the problem that makes a host inaccessible.
traceroute is nice and good, but slow. This trace took in excess of ten seconds. Also, I specified the -n argument which causes traceroute to show IP addresses instead of names -- otherwise it would have been really slow.
mtr beats the crap out of traceroute. It does the same thing, only in parallel (yes, even converting the IP addresses to meaningful names. I'm going to show you a screen capture, but a video (I'm too lazy for that) would do it more justice -- with mtr you see, in real time, the speed of each one of the hops in the way:
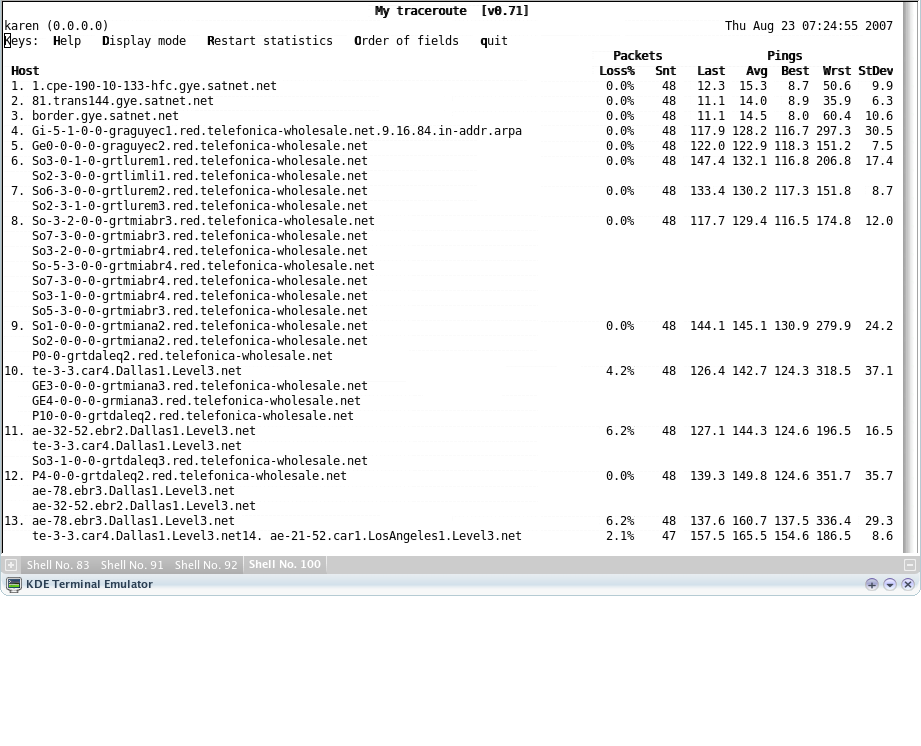
Moreover, you can keep it running and it will keep on running, updating its display every few times a second. Very useful to pinpoint the faulty spot on sporadic/temporary network outages!
Try it out. Install mtr using your distribution's package management utilities, then run mtr yahoo.com. Then try it on another host. Tip: if roundtrip times are more than two hundred milliseconds, you can forget about playing Unreal Tournament with that computer.
Oh, thanks again, Thomas!
Now, let's discuss flow analysis, and how to identify applications that are hogging your network.
Flow analysis: what's going on, and where
The tools we have seen so far are quite useful, but sometimes you want to point your finger at a network hog. And none of them are useful for that. What we'll do this time is inspect two (quite popular, I must confess) programs used to do flow analysis -- figuring out how traffic is apportioned, which program or network service is responsible, and where it goes.
iftop: network usage in real-time
I'm not gonna explain why the program iftop is named iftop -- I'm just gonna say iftop rocks. iftop. Damn, that's a lot of iftops on one sentence!
In short, iftop shows you how network traffic is being apportioned, breaking it down by host. This, for example, is a screenshot taken from my computer:

You can see three distinct flows in the three rows there, and the black bars depict the relative network usage for each flow (two bars per flow -- one for incoming and one for outgoing traffic). The last rows in the shot display the total network usage.
The two flows after the first are irrelevant -- we'll ignore them -- because they are broadcast traffic from either Avahi or Windows network browsing. As they say in the Wizard of Oz, do not pay attention to the man behind the curtain.
However, the first row is a lot more interesting. It shows a steady flow of data, in the vicinity of 1.6 megabits per second, from my "desktop" computer to my PVR computer. You see, my "desktop" computer is a Dell PowerEdge blade server, too loud to use as a desktop, and too cheap to have a sound card.
Since I'm a cheap and poor bastard, instead of bothering with an USB sound card for the PowerEdge, I just reuse one of the several sound cards in my PVR computer through the network and the magic of PulseAudio. Yes, I'm listening to music on my "desktop" computer, and the audio travels through my local network into my other computer, which relays the audio to my stereo, through my speakers, to my ears. You get the point.
Now here's a more meaningful screenshot, displaying network usage of my Internet connection (in this case, I typed the command iftop -i eth2 on the terminal window):
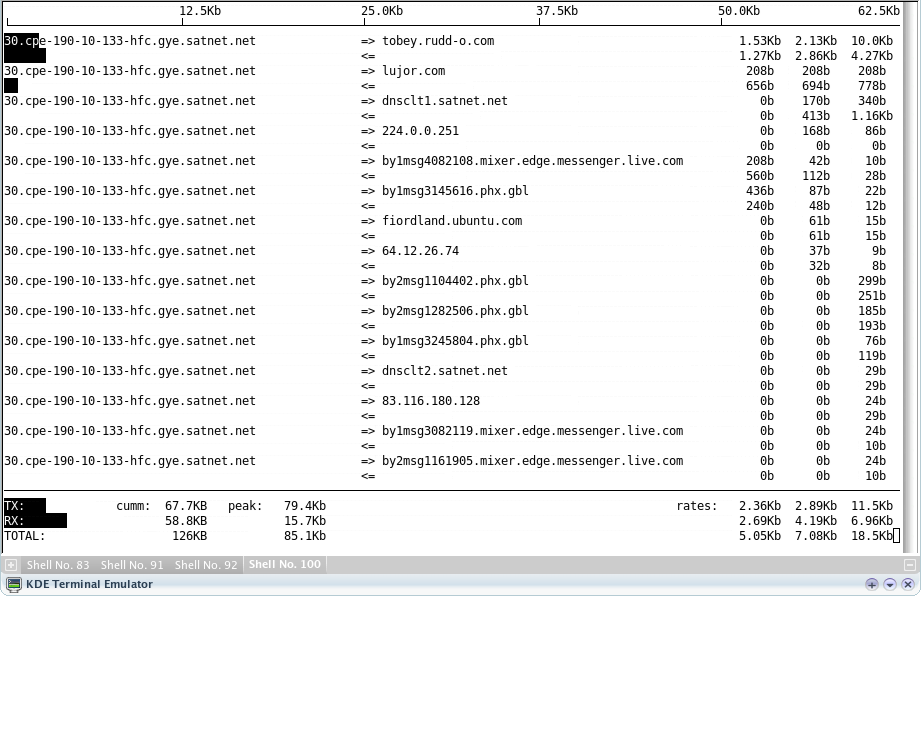
Now you can see a lot more flows -- why are the Messenger servers so intent on focusing in my computer? Well, I guess I now have homework to do, start investigating if anything's wrong.
Try iftop out. Use your Linux distribution's package manager to install iftop, then just run it on a terminal window (you may have to type sudo iftop to run it, because it requires administrative privileges). When you're bored, close it down. However, don't get surprised if you see a lot of traffic going in and out while downloading BitTorrent torrents.
Don't forget to read the iftop manual page as well (type man iftop on a terminal window). It's got lots of information for you to learn more, and a couple of other usage modes -- I like the one that shows me each protocol independently, and the other one that shows traffic in Bytes per second instead of bits per second. Very useful.
But there's a prettier tool.
Etherape: network usage in real-time, with graphical goodness
Remember iftop? Well, Etherape is like iftop, only cooler because it's a graphical program:
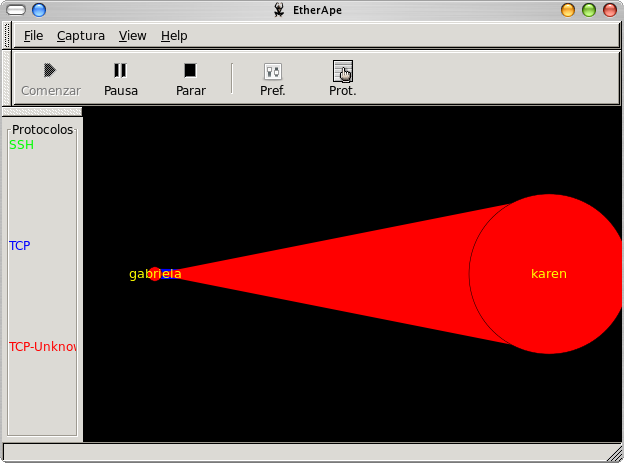
This is the very same network activity shown in the first iftop screenshot. Notice how the flow is now colored and has a distinct size based on which host is sending the traffic? Now here's a screenshot of Etherape capturing and displaying traffic on my Internet connection:
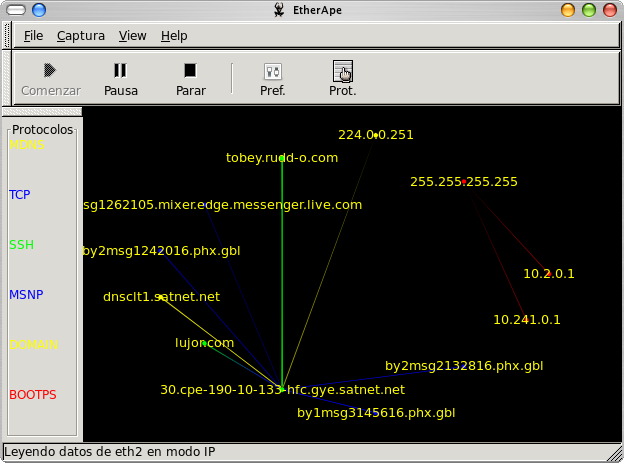
Note how it's much easier to discern network activity? Etherape colorizes traffic according to protocol, and each protocol gets a distinct color. You can use this neat tool to find out which kind of traffic is bogging your network down. Admittedly not very useful if you're using it on your own computer, but an absolute must if you are diagnosing traffic issues on an Internet gateway. You know, these pesky users downloading movies and music? They stand right out on Etherape.
The reason I prefer iftop to Etherape is simple, and related to my job: I can use iftop to diagnose remote hosts much more easily. When I run Etherape on another host, it runs slowly because my Internet connection isn't exactly great, and Etherape needs to send the pictures over the Internet. iftop's much quicker because it only sends characters. But you can't deny Etherape is prettier.
Now let's find out what exactly all these programs are talking about on the wire. You didn't know that was possible, did you?
Traffic inspection with Wireshark
As always, we're leaving the best for the last. Wireshark is different from all the tools you've seen so far. It's much harder to use, basically because it requires intimate knowledge of TCP/IP and many network concepts. It's also harder to use because there's no simple "overview" that you can derive from using Wireshark: it's down-to-the-wire details all the way.
Which makes it brutally useful to diagnose problems where identifying network chatter is essential to figuring out what is going wrong. Check this screenshot out to see what I mean:
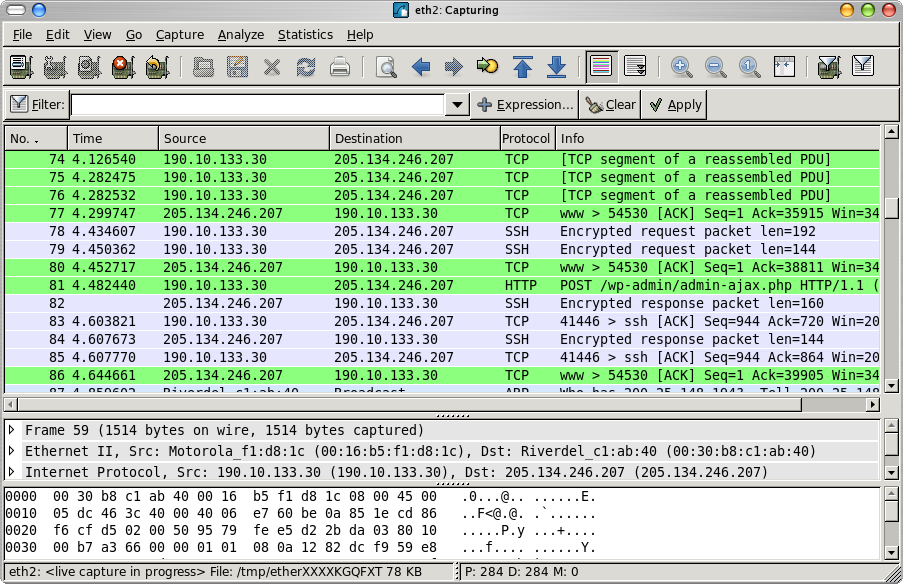
Network chatter, as I was saying, is what Wireshark's all about:
1) Each row in the first pane displays an overview of each packet that Wireshark has captured.
2) The second pane provides a dissection of whatever packet is selected on the first pane, down to the bits and what each mean.
3) The third pane shows the actual packet contents in hexadecimal and textual views.
There's another view that warrants further attention. For most packets, you can right-click on any packet listed on the first pane, and choose an option titled Follow TCP stream:
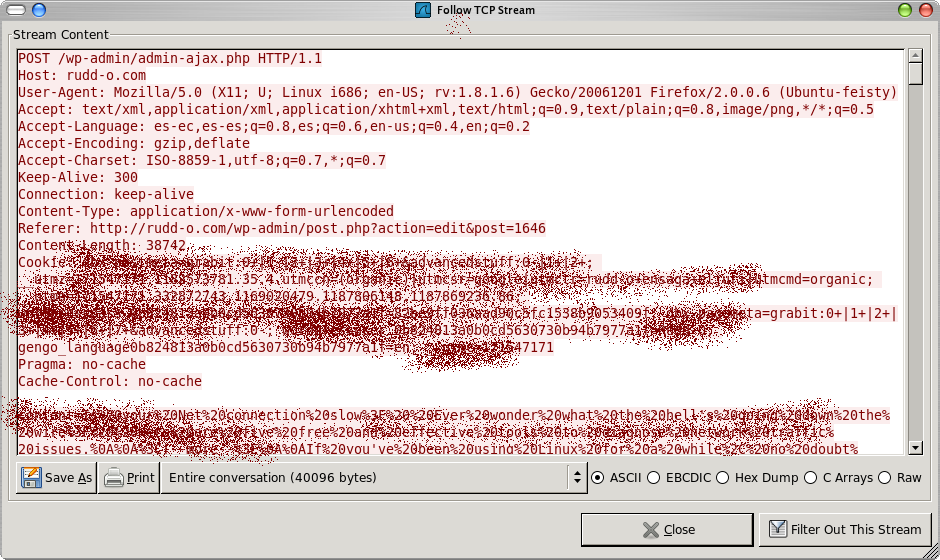
Sorry about the blur you see on this screenshot, but I had to black out certain areas lest I be hacked like a steak. The point of the screenshot is to show you one of the essential features of Wireshark: network chat in real-time. In this shot, text colored in red was sent by the initiating host, while text colored in blue was sent by the responding host.
In short, Wireshark will capture network traffic from any host and to any host that crosses your Ethernet (or wireless) connections. It's one of those tools that "remove the magic factor" from computers, because it lets you see, in real-time, what the hell your computer (and others) is doing with your network connection.
As of now, I'm not sure if you perceive the looming danger with Wireshark. It's practically the reason all secure network protocols use encryption (OK, technically it's malicious Wireshark users sitting on network routers). Encrypted protocols appear mostly as gibberish to Wireshark. Unencrypted protocols, like HTTP and Telnet, do not. That's why I had to blur my screenshot.
However bad you think tools like this are widely available, you cannot deny their usefulness. Without it, I'd be out of a job -- keep in mind that my job does not include network penetration testing, yet I still find myriad uses for Wireshark.
I'm getting too political now. Just grab it and use it. If you don't, you'll never know what you were missing. If you do, you might learn a thing or two about network security you didn't know were there.
The wrap-up
OK, that's about everything you must know if you want to diagnose a network problem. I'm not going to show you the evil tools now (hey, Wireshark is borderline evil and outright illegal in Germany), but rest assured at some point I will show you how to use them as well.
In the meantime, back to my evil deed... I mean, day job.